Opportunities for sustainable economic recovery
25.09.2020
OECD presented an analytical note "Green recovery: jobs, income and growth". The document focuses on how countries can create opportunities for green and inclusive economic recovery after the COVID-19 pandemic. Environmental impacts of COVID-19 1. Air pollution has temporarily decreased as industrial activity, ground transportation, and air travel have been reduced for several months. However, the example of some states became known about the return to a high level of atmospheric gas pollution. 2. Reduced economic activity has led to improved water quality in a number of waterways and coastal zones. A number of countries and regions reported reduced concentrations of suspended solids and other water pollutants. However, this is also a temporary phenomenon. After the resumption of economic activity, the pollution of natural reservoirs increased. 3. Waste management issues have increased significantly as a result of the pandemic. Governments are facing a significant increase in medical waste (mainly due to disposable personal protective equipment), increased demand for single-use plastics (for food, food delivery, medical supplies), as well as reduced recycling capacity and collapse in market prices for recycled plastic. In this regard, the use of masks by the general population creates serious waste issues. 4. Along with COVID-19, other deadly pathogens have become more active - Ebola, HIV, dengue, SARS, MERS, zika, West Nile virus. 5. There has been an increase in poaching and illegal resource extraction in some countries, due to the loss of rural livelihoods and reduced monitoring and enforcement capabilities. EU Green Deal: recovering from the pandemic The European Commission at the end of 2019 proposed a new growth strategy - European Green Deal. Its goal is to build a greenhouse - free economy by 2050 and reduce the relationship between economic growth and resource use. The European Green Deal is at the heart of the EU strategy to stimulate economic recovery from the COVID-19 pandemic, in particular through Next Generation EU, EU recovery instrument worth EUR 750 bln. Achieving the goals of the European Green Deal will require action in all sectors of the economy, including:
Creating jobs in green recovery Various green industries and activities offer significant opportunities for job creation. RES, especially solar photovoltaic cells, can employ more people per unit of investment and energy than fossil fuel production. By 2050, more than 40 million people could be employed in RES, and total employment in the energy sector could reach 100 million by 2050, compared to about 58 million today. The potential for creating new jobs in energy efficiency is estimated at 2.5 mln per year. Ecosystem recovery in the United States provides direct employment to 126,000 workers annually. In addition.organic farming has the potential to create jobs. A number of studies have shown that the need for labor per hectare o.organic farms is higher than that of their traditional counterparts, given that they have more labor-intensive production activities. Sustainable financing for recovery
The analytical note can be found at the following link Green recovery
indicators
For the purpose of
monitoring the impact of measures to promote environmental outcomes, OECD has
identified a list of 13 key environmental indicators:
Table 1. Environmental indicators for green recovery
1. Since 2000, the
carbon intensity of OECD countries and key partners has declined, indicating
that CO2[1] emissions are increasing more slowly than real GDP.
However, global CO2 emissions continue to grow, and the ratio between CO2 and
economic growth is not sufficient to meet the goals of the 2015 Paris
Agreement;
2. Although several
OECD countries have increased the use of renewable energy sources (RES), the
overall share has increased slightly over the past two decades. The growth of
RES occurred mainly in the electric power industry due to state support.
3. Current carbon
prices do not provide sufficient economic incentives for companies to reduce
costs to mitigate future impacts. They also do not provide incentives for
investment that takes climate risks into account and supports economic growth.
4. Support for the production and consumption of fossil
fuels continues to prevail in most OECD and partner countries. Among energy
source materials, oil remains the largest support component (about 75%),
followed by natural gas, electricity and coal. Currently, there are about 1,200
government programs supporting fossil fuels in OECD and partner countries.
These support measures undermine global efforts to reduce the effects of
climate change.
5. Loss of natural and semi-natural areas contributes to
CO2 emissions and puts pressure on biodiversity due to fragmentation and
habitat loss.
Figure 1. Losses of natural and semi-natural areas 1992-2018. 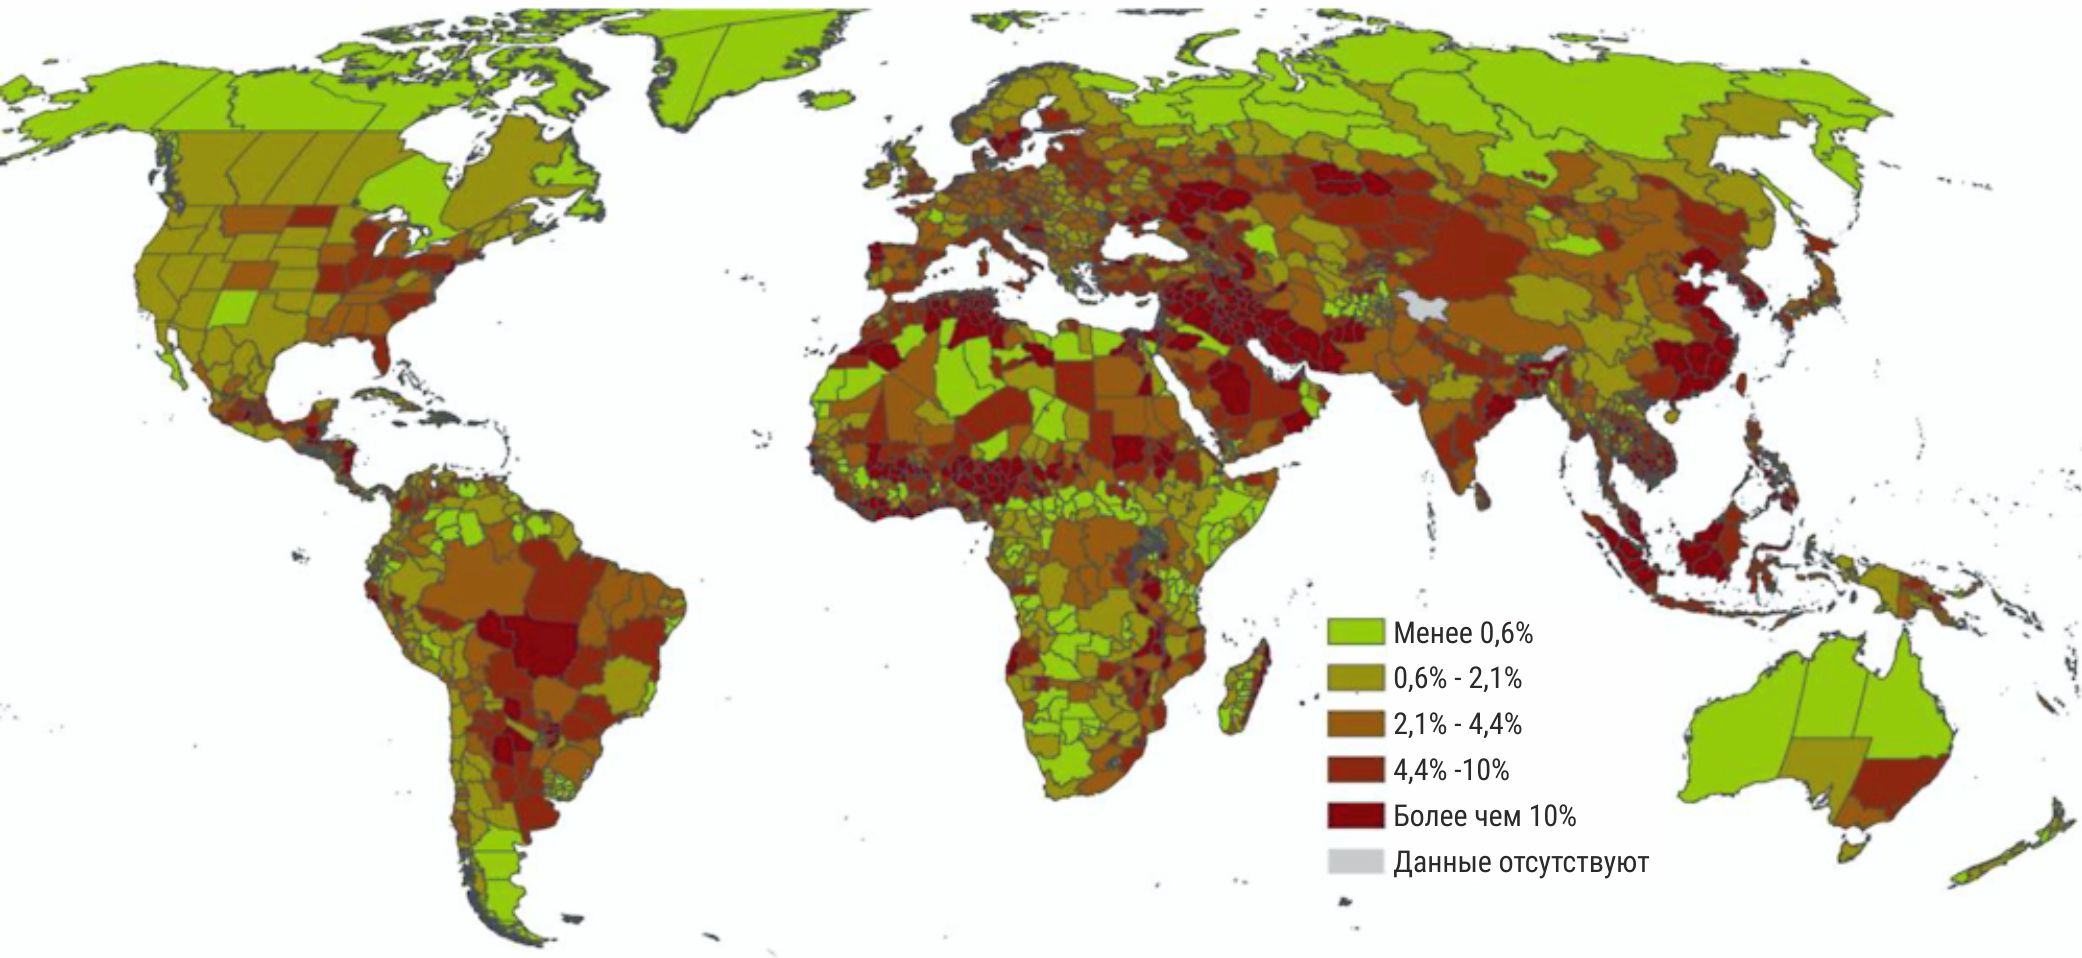 However, in desert regions, small changes may be significant in percentage terms; conversely, very large natural land losses in regions with heavy forest cover may seem modest. 6. The size of protected areas is growing in most countries. In OECD countries, they cover an average of 16% of the land area and 20% of the sea area, compared to 10% and 2% in 2000, respectively. 7. In 2020, there are 458 biodiversity-related economic instruments in operation in 41 OECD and key partner countries, of which 30% are at the subnational level. In 2000, 36 countries had active instruments, and their number was 20% less. 8. Despite reduced exposure to air pollution (PM2.5), the population of most OECD countries is still chronically exposed to harmful levels of PM2.5. The highest levels of PM2.5 are observed in the Sahara, the Middle East, India and China, but the problem is serious in OECD countries, especially in cities. Less than one in three OECD countries meets WHO Air Quality Standards for average annual exposure to PM2.5 at 10 micrograms per cubic meter mcg/m3. Even this value is not a "safe" level and is associated with an increased risk of heart and respiratory diseases. 9. Productivity of non-energy materials is improving in most OECD countries,while it remains low in key partner countries. In 2018, OECD countries received about USD 4 thous. in revenue (in terms of GDP) per ton of non-energy materials used. This is more than four times the cost generated by key partner countries (USD 900 per ton). 10. Most OECD countries face seasonal or local problems of freshwater scarcity. In more than one-third of OECD countries, freshwater resources are under moderate to medium-high stress. In some countries, water resources are plentiful and population densities are low. Some of them have extensive arid or semi-arid areas where water scarcity hinders economic development. In these cases, the public water supply shall rely on other sources of water (for example, desalinated seawater or non-renewable ground water). 11. Innovation will help achieve environmental goals at a lower cost and open up new business opportunities and new markets. State budgets for research and development in many countries have increased since 2000. However, the amount allocated to environmental purposes remained relatively stable across OECD as a whole, with large differences between countries in the change in this share. 12. Overall, the share of environmental-related tax revenue (ERTR) continues to decline in OECD countries, accounting for 5.3% of total tax revenue in 2018, compared to 6% in the early 2000s. ERTR is also declining relative to GDP and fell to 1.5% GD in 2018. The main part of revenue comes from taxation of energy (71%), in particular, motor fuel, and transport (26%), while the base of the tax on pollution and resources plays a secondary role in generating revenue. 13. Official development assistance (ODA) is an important source of state-funded international investment. Members of OECD Development Assistance Committee (OECD-DAC) provide up to 95% of global development assistance. The ODA amount for environmental protection intended to address the issues of biodiversity, climate change and desertification under the Rio Convention has been increasing since 2010. The analytical note can be found at the following link
Views: 5050 |
|
||||||||||||||||||||||||||||||||||||||||||||||||||||||||||||||||||||||||||||||||||||||||||||||||||||||||||||||||


|
|