OECD overview
20.08.2021
Growth and economic well-being: Q1 2021, OECD[1] OECD household incomes grew strongly in Q1 2021, due to significant tax incentives in the United States.
Real household income per capita, which shows a better picture of people's economic well-being than GDP, grew by 5.8% in the OECD countries as a whole in the first quarter of 2021. This increase, being the largest since 2008, is largely due to a significant increase in real household income in the United States, which is a direct result of recent financial support provided by the Government, including transfer payments made to households. This exceptional income growth was much higher than the GDP per capita growth (by 0.5%) recorded in the OECD countries in Q1 2021.
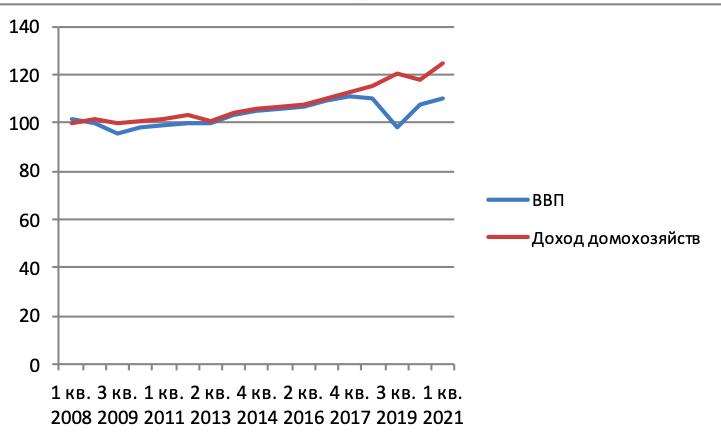
As a result, the discrepancy between GDP per capita and household income per capita has remained in this quarter since the beginning of the COVID-19 pandemic. Since Q4 2019, real household income per capita in OECD countries as a whole has increased by 8.2%, while real GDP per capita has decreased by 2.7%. Real household income per capita and real GDP per capita Percentage change compared to the previous quarter; seasonally adjusted data
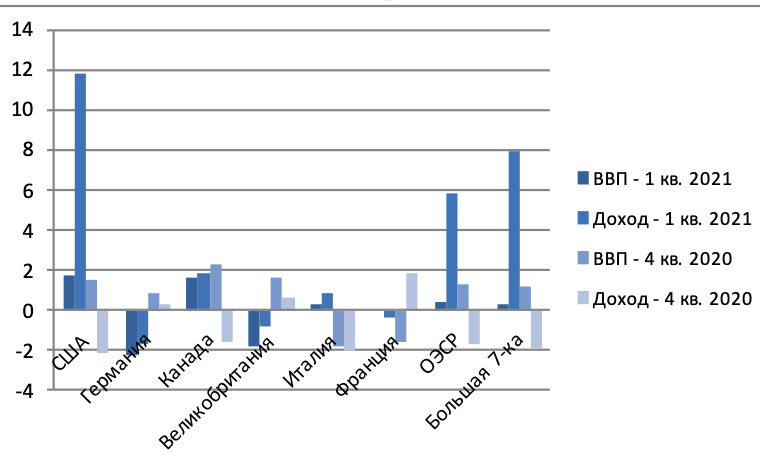
Source: OECD Household Dashboard: Cross-country comparison In the US, there was a significant increase in real household income per capita by 11.7% in Q1 2021. This increase followed the implementation of two separate, large-scale government financial measures to support households, related to the Coronavirus Response Additional Supplemental Appropriations Act 2021, and then the American Rescue Plan Act of 2021. While real GDP per capita in the US also increased (by 1.5%) during the first quarter of 2021, the difference between the two indicators, along with a large increase in the level of personal savings in the US for the 1st quarter of 2021, reflects that most of the additional income was used to improve personal balances, and not spent on personal consumption. The dynamics of real household income per capita also tracked the dynamics of real GDP per capita among the other seven largest economies, although on a smaller scale. An increase in real household income was observed in Canada (1.5%) and Italy (1.0%), where there was also a slight increase in GDP per capita by 1.3% and 0.4%, respectively. On the other hand, the decline in real household income recorded in Germany (- 1.4%), Great Britain (- 1.1%) and France (- 0.6%) was accompanied by a decrease in real GDP per capita (- 2.0%, - 1.7% and -0.1%, respectively). In other OECD countries, real household income per capita increased in Denmark (6.7%), Hungary (3.1%) and Poland (2.9%). Conversely, a more significant drop was recorded in Austria (- 11.6%), Chile (- 8.7%), Belgium (- 2.2%) and the Czech Republic (- 1.7%). Real household income per capita and real GDP per capita: Q1 2007 = 100
OECD Household Dashboard: cross-country comparison
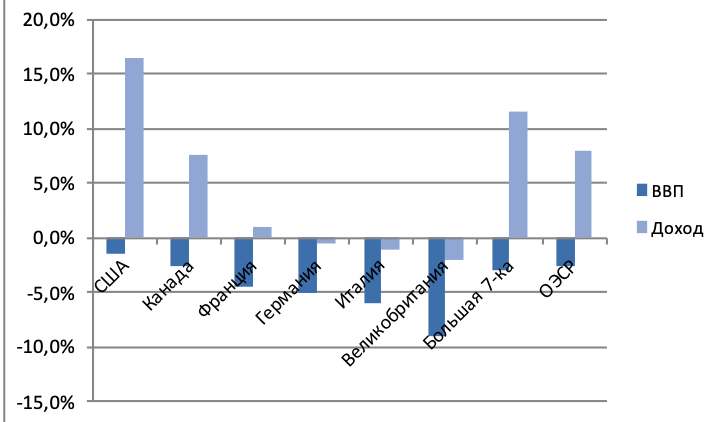
To eliminate some of the instability caused by the pandemic, it is worth looking at the cumulative increase in measures since any restrictions related to the coronavirus pandemic were introduced. From this point of view, the United States (16.4%) and Canada (8.2%) recorded a significant increase in real household income per capita, which is explained by the significant financial support provided by the governments of these countries. In addition, thanks to government support in the G7 countries, the rest of the countries showed only a slight decrease (or a slight increase) in real household income per capita, despite the negative aggregate GDP growth per capita in all countries in the range from -9.4% in the UK to -1.3% in the USA. Real household income per capita and real GDP per capita Cumulative percentage change since Q4 2019; seasonally adjusted data
Quarterly real household income per capita Percentage change compared to the previous quarter; seasonally adjusted data
Source: OECD Household Dashboard: Cross-country comparison
Quarterly real GDP per capita Percentage change compared to the previous quarter; seasonally adjusted data
Note: As a result of measures taken by Governments to reduce the spread of coronavirus (COVID-19), many statistical agencies are facing unprecedented problems in the collection, compilation and methodology for developing indicators in a number of areas. To address these challenges, the statistical community is developing guidelines, both conceptual and practical, that will help ensure the continuous provision of timely and reliable statistical data. However, in some cases, this will inevitably affect the quality, and therefore the statistics included in this press release may be subject to more extensive and frequent changes than usual. Conclusion The forecasts are characterized by significant uncertainty, although the risks have become more balanced between potential positive and negative impacts. In countries where vaccination is not widespread, the risk of new outbreaks remains very high with possible emergence of new vaccine-resistant variants of the virus. This may cause further measures to contain and slow down the economic recovery process.
On the positive side, the high levels of household savings accumulated during the crisis can be released as the economy resumes, which will lead to an increase in consumption and growth to higher than expected levels, especially in developed world economies. ______ [1] — https://www.oecd.org/newsroom/growth-and-economic-well-being-first-quarter-2021-oecd.htm
Views: 4917 |
||||||||||||||||||||||||||||||||||||||||||||||||||||||||||||||||||||||||||||||||||||||||||||||||||||||||||||||||||||||||||||||||||||||||||||||||||||||||||||||||||||||||||||||||||||||||||||||||||||||||||||||||||||||||||||||||||||||||||||||
|
||||||||||||||||||||||||||||||||||||||||||||||||||||||||||||||||||||||||||||||||||||||||||||||||||||||||||||||||


|
|